Covariance Calculator
Our covariance calculator measures the relation between the two sets of variables often referred X and Y. It is an online statistics calculator for covariance, which involves two random variables X and Y and calculates variation between these two variables. It assists us in comprehending the relationship between two data sets.
How to use covariance calculator?
- Enter values for first data set X.
- Enter values for second data set Y.
- Separate the values by using comma.
- Hit the Calculate button.
What is covariance?
Covariance tests how much in one population, two random variables (X, Y) vary. If the population has higher dimensions or random variables, the relation between different dimensions is represented by a matrix.
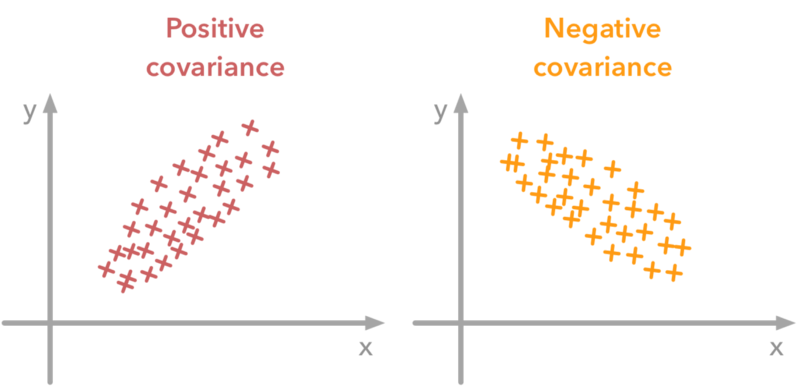
- Covariance score will be positive for smaller and bigger X & Y values.
- Covariance will result in a negative number for bigger X values and the smaller Y values .
- The covariance will be zero or non-linear if the two random variables are not statistically dependent.
Sample covariance formula
The following covariance equation is the formula for sample covariance if two equal-sized samples are available.
Covsam (x, y) = sum (xi - xmean) (yi - ymean) / n
Where,
x1, x2,..., xn represent the first sample elements,
y1, y2, ..., yn represent the second sample elements,
xmean and ymean represents the average values.
The relationship between covariance and variance can be written as:
Cov (X, X) = Var (X)
Here is the population covariance formula.
Covpop (X, Y) = sum (xi - xmean) (yi - ymean) / (n-1)
How to calculate covariance?
We will see how the covariance formula works in a real-life situation by using a real-life example.
Example:
Garret is an investor who recently bought his first few shares in "Home for all," which is a real estate company. Yet Garret had to diversify his investments, and therefore decided to buy certain shares in both the “Stars Estates” and “Your Property.”
The problem for Garret is which companies he should invest in. That is where covariance comes in handy to decide for Garret.
Solution:
For stocks of the “Home for all” and “Star Estates,” denoted respectively by xi and yi, Garret randomly selects five closing rates.
| i | xi |
| yi | x diff | y diff | x diff × y diff |
| 1 | 11.24 |
| 8.30 | -0.124 | 0.048 | -0.00595 |
| 2 | 11.22 |
| 9.21 | -0.144 | 0.958 | -0.1380 |
| 3 | 11.99 |
| 10.71 | 0.626 | 2.458 | 1.5387 |
| 4 | 11.45 |
| 8.01 | 0.086 | -0.242 | -0.02081 |
| 5 | 10.92 |
| 5.03 | -0.444 | -3.222 | 1.431 |
| Mean value | 11.364 |
| 8.252 |
If you are wondering about how to find covariance from here, follow these steps, or you can use our covariance tool to find covariance quickly.
- First of all, we will calculate the mean value of the closing prices for the “Home For All” stocks, which you can find in the column named xi. Add all of the five values of these closing prices and divide them by the size of the sample, which is 5. We will get the average value for this company as xmean = 11.364.
- Now, calculate the mean value for the second company, “Star Estates.” The mean value of the closing prices of the second company will be ymean = 8.252.
- We will calculate the x diff and y diff for all values. Subtract each value of xi from its mean value, which we have calculated in the previous steps. Use xdiff = xi - xmean for x and ydiff = yi - ymean for y.
- Calculate the product of xmean and ymean by multiplying the values from both columns and write it in the next column.
- Add all the values of the last column, which is the product of both differences. After adding the values, divide it by the size of the sample, which is 5. You will get the sample covariance, which is 0.561, in this case.
We can say that the closing price for both companies varies to around this calculated value of covariance (0.561).