What is NPS Chart and When to Use It?
When dealing with the NPS chart, also known as the Net Promoter Score, one will realize that every customer service metric has a considerable impact on the success of the business. In addition, your score only turns out positive depending on what you do with the data you get back after the analysis process. When customers make specific grievances about what they want, it's your responsibility to analyze the data and serve them with exactly what they need.
The role of the business owner is to ensure that customers are satisfied by offering solutions to the problems they encounter in their daily lives. A calling center can be a great resource to help pinpoint your whereabouts. Once a customer raises a given issue, you need to analyze keenly what they say, fix various pain points within the company, or even create new products that suit the customer's needs.
Business owners should be keen listeners and observers to ensure they get a clear customer message. As a result, this is likely to reduce the churn rate and contribute to the company's success. The NPS chart is used to convert survey data into a goldmine in the form of insights. Let's get to the nitty-gritty part of the process and help you understand better!
What is the Net Promoter Score Chart (NPS)?
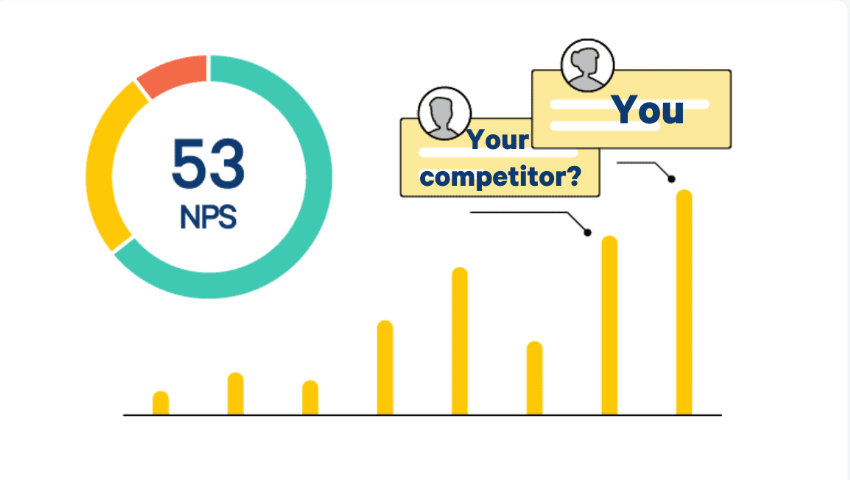
The Net Promoter Score Chart is a popular metric used to measure customer experience and showcase the rate of customer satisfaction. The chart is mainly used to help you get a general idea about the level of customer loyalty. Also, it helps to determine whether various customers will continue using the products or services you offer in the future.
To get the NPS score, you need to ask your customers a question within any of your preferred fields. The chart has a scale you need to use once you get customer feedback. For instance, you can ask how likely your customers will recommend your company to their family and friends on a scale between 0 and 10.
When customers respond to your question, the answers are compared to the scale that converts the response into data that can be quantified. Let's discuss what the ratings on the 0 - 10 scale reflect.
Detractors, 0 - 6
This range represents a group of customers who are not satisfied. Also, they will likely tell their close friends and family not to use your products or services. They are likely to tarnish the name of your business and ruin its reputation.
Passives, 7 - 8
When you get responses that fall in this category, you need to understand that these customers are not loyal or disloyal. The only problem is that the chances of recommending your company to their friends and families are minimal. Also, they are likely to choose your competitor over you once they get a good deal on the other side.
Promoters 9 - 10
This group represents some of the most loyal customers that you have within your company. These customers are likely to recommend your brand to their close friends and family. In addition, they tend to come back on regular occasions to seek various products or services.
To get better results when using an NPS chart, you should consider asking a closed-ended question followed by an open-ended question to get more clarification on the answers given by customers.
Why You Need to Collect NPS Data
As outlined in the above discussion, it's evident that your NOS score can help you evaluate the loyalty of your customers. Researchers say that approximately 50% of existing customers are more likely to prefer trying out a new product or service that has been introduced in the market. Also, they are likely to spend a lot of money within the business compared to visitors.
When you consider all the features, you will realize that the NPS tools help you of great use in showcasing the growth strides of a given company, such as Zonka Feedback, which provides comprehensive insights through its feedback and survey tools. Companies that record a positive score within three to four years tend to record better results and increase their return on investment. Companies that use the chart in the right context tend to double their profits and general returns.
Net Promoter Score Data Analysis
Before coming up with the Net Promoter Score, you need to consider various factors that will help you to identify the accurate values to use. It's obvious that when using charts and graphs, you need to consider having the right approach, and everything works well. Consider the hacks shared below.
Calculating the Net Promoter Score
To calculate the NPS, you must start by determining the percentage of the promoters and the detractors. Once you have these two figures, you can easily get your score by subtracting the detractors from the promoters. Even though passives are not incorporated in the NPS calculations, they tend to have essential information that can be collected using an open-ended question.
In addition, they mostly operate as promoters compared to detractors making them easy to convert.
What is a Good NPS?
Even though this question seems to be straightforward and simple, it involves a lot of things that impact the final results. The score can vary depending on circumstances such as geographic location, industry, and timing. To generalize everything, you need to understand that anything above 0 is good.
Any mark beyond 50 is excellent while recording any figure from 75 is considered a wild class. When you have any figure under the 0 limit, you need to focus on improving your business since you have more detectors than promoters. To benchmark yourself and enhance the well-being of your business, you need always to consider your past score and evaluate if you are making any improvements or not.
This will give you the drive to ensure that you are serving your customers correctly and they get satisfied. As a result, you will get it easier to propel your business to the next level and serve customers with what they need at the right time and during the right season.
When to Conduct Your Net Promoter Score.
To benchmark your results against past results, you need to have a detailed survey schedule. This means that you must create a sequence about when you will have to conduct the survey within your target market to compare and contrast the final results. When doing the survey, you should consider using neutral touch points that will help you get a clear impression of the nature of your educational audience.
When you want to generate the Net Promoter Score for specific points within the business, you also need to be specific to get reliable results. The only weapon that can save you at this point is to tweak your survey questions and ensure that they are attracting specific answers that are vital to the success of your strategies. To make the survey creation process easier, consider using a survey maker tool that can help you design customized surveys based on your specific needs and goals.
Conclusion
The NPS chart is a reliable tool that you can use to analyze customer sentiments and generate reliable conclusions that will impact the success of your business. The chart enables you to place customer response on the scale and convert it into measurable data that can be used in decision-making. The Net Promoter Score can help you in decision-making and offer guidance about what customers want the business to provide. It's also a good means to use when you want to detect any areas of weakness within your business and how you can mitigate the circumstances.